In This Article:
PDFS
The PDFS Paradox: Unpacking the Hidden Institutional Trapdoor Behind a 100% Rally
BearishStrongChange from report: -31.4%1M: -28.2%
Published on 2026-07-01 by TradeFomo
The Surface Illusion: Growth and Golden Crosses
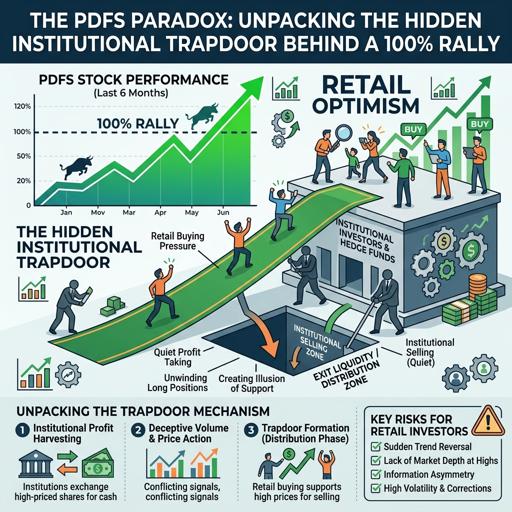
If you look at the mainstream financial feeds today, PDF Solutions Inc. (PDFS) is the ultimate tech darling. Since bottoming out in the low $30s in early April, the stock has gone on a relentless, parabolic run to close out June at $70.79. Retail momentum chasers are pointing to the Q1 earnings report—26% YoY revenue growth, 76% non-GAAP gross margins, and a healthy $246.4M backlog. Technical analysts are salivating over the continuous "Golden Crosses" and a seemingly unbreakable string of yearly highs.
But if you have learned anything from market history, it’s that when a stock doubles in two months on the back of a secondary offering, you don't look at the moving averages—you look at the plumbing. And beneath the surface of this historic rally, the dark pool and options data are screaming that a massive, orchestrated institutional distribution is underway.
Off-Exchange Plumbing: A Masterclass in Distribution
To understand the mechanics of this rally, we must synthesize the linkage between the TRF ratio, short percent, Vol Z-score, and rolling CLV. When we merge these four indicators, a stark picture of hidden institutional behavior emerges. Over the latter half of June, the TRF ratio (off-exchange trading footprint) has repeatedly spiked into extreme percentiles (exceeding the 96th percentile on multiple sessions), indicating that whales are moving massive size away from the lit exchanges to mask their footprints. Concurrently, the Vol Z-score exploded, hitting a massive 2.10 on June 26. When you see the TRF ratio and Vol Z-score peak together after a 100% parabolic advance, it is almost always a climax signal—a volume exhaustion event marking the initiation of a violent new trend reversal. Yet, the rolling CLV (which measures the strength of the close) has remained pinned in the bullish 0.68 to 0.83 range, while the short percent has steadily dropped from its April highs (0.80+) down to the 0.40s. This creates a classic volume-price divergence: institutions are systematically supplying shares off-exchange into retail's relentless buying pressure, effectively capping the true momentum. They are painting the tape strong at the close (high rolling CLV) and forcing out the last remaining lit-market shorts (dropping short percent), all while quietly offloading their own inventories in the dark pools.
The Volatility Underbelly: Delta Squeeze Meets Tail-Risk Hedging
If the off-exchange data suggests distribution, the options extra time-series data confirms that smart money is aggressively bracing for impact. Let’s look at the net DEX and net GEX. The net DEX is overwhelmingly positive (climbing from around 9 million in early June to over 15 million by June 30), meaning that institutional market participants are still maintaining a heavily long directional Delta exposure, effectively weaponizing this squeeze. However, the net GEX trend reveals the cracks in the ice. In early June, net GEX was robustly positive (peaking near 350k on June 8), providing dealers with the long Gamma cushion needed to suppress volatility and keep the price grinding steadily upward. But as the month closed out, net GEX was slashed in half to roughly 155k. We are rapidly approaching a zero-gamma threshold; if net GEX flips negative, dealers will be forced to sell into weakness, amplifying downside price velocity. Most tellingly, while institutions are riding the long Delta wave, the OTM put/call OI ratio—our premier indicator for tail-risk hedging—has printed absolute anomalies. Mid-June saw this ratio explode from sub-1.0 levels to 43.9 on June 11, and an absurd 77.0 on June 15. This is the smoking gun. You do not buy 77 times more out-of-the-money puts than calls unless you are acutely aware that the floor is about to cave in.
Pricing the Drop: Option Walls and Term Structure
Taking a snapshot of the current options structure allows us to see exactly where the market is pricing the inevitable mean reversion. The macro call wall at strike 55 (expiring in August) has already been completely blown out by the recent squeeze, leaving the front-month call wall at 90 as the absolute ceiling for this irrational exuberance. But the downside targets are where the gravity lies.
The front put wall sits heavily at strike 60 for July 17, and the macro put wall is anchored way down at 22.5. Looking at the GEX by expiration, the vast majority of the gamma exposure is not in the near term—it is concentrated in the August (55k) and November (87k) macro cycles.
Furthermore, the volatility term structure is heavily inverted. The 22-63 day implied volatility is sitting at a massive 1.187, wildly overshadowing the longer-dated IV of 0.705. The options market is explicitly pricing in a high-velocity, localized structural break in the next 1 to 2 months. The skew is paying up for mid-term downside protection while retail continues to blindly bid up near-term calls.
The $44 Reality Check
If you need a final, fundamental nail in the coffin, look at the SEC filings. On May 13, when PDFS was trading around $52, the company and a major shareholder (Advantest America) priced a massive secondary offering at exactly $44 per share. Advantest dumped over 3.3 million shares to exit their stake, and the company printed 1.9 million fresh shares to raise $85 million.
Insiders and major institutional holders literally told you what they believe the fair value of this stock is: $44.
The fact that retail euphoria and a mechanical gamma squeeze have pushed this stock into the $70s does not change the underlying intrinsic gravity. Needham may have picked up a 5% stake around the offering, providing a temporary floor, but the smart money has spent the last month hedging their downside, moving shares to dark pools, and starving the market of the dealer gamma needed to support this elevation.
PDFS is a great company with a solid product. But right now, the stock is a mechanical trap. The Delta squeeze is running out of oxygen, the TRF distribution is climaxing, and the institutional put-hedgers are sitting with their fingers on the eject button. Trade accordingly.