In This Article:
NUE
The Steel Trap: Why Nucor's Parabolic Rally is Masking a Liquidity Mirage
BearishStrong
Published on 2026-08-09 by TradeFomo
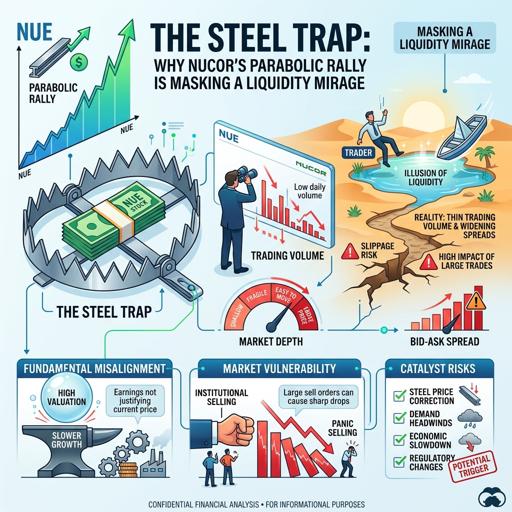
The Surface Illusion
Everyone is clapping for Nucor Corporation (NUE). Up 96.8% over the past year, trading near all-time highs of $272, and printing an eye-watering $5.04 EPS in their Q2 earnings. The Basic Materials sector looks bulletproof, and the retail herd is blindly chasing the momentum. But if you've been in this game long enough, you know that the loudest cheers often hide the quietest exits. The smart money isn't buying this breakout—they are monetizing it. And the data footprint they are leaving behind across off-exchange facilities and derivatives markets is blindingly obvious if you know where to look.
The Off-Exchange Confession
To truly understand the institutional sleight of hand occurring in Nucor right now, we must examine the delicate interplay between the TRF ratio, short percentage, volume Z-score, and rolling CLV. When analyzed together, these four metrics expose hidden off-exchange accumulation or distribution, abnormal fund flows, and critical volume-price divergences. On July 28 and again on August 5, we saw the TRF ratio and the volume Z-score simultaneously hit recent extremes (with the TRF ratio pushing the 98th percentile and the volume Z-score spiking to 1.47 and 2.11). Historically, when the TRF ratio and volume Z-score print concurrent extremes on the same day, it signals the ignition of a new directional trend. However, while off-exchange activity exploded, the short percentage plummeted to the 23rd percentile by August 7, completely evaporating the off-exchange shorting pressure. Meanwhile, the rolling CLV, which tracks the multi-day shift in closing long versus short power, peaked at an extreme 0.969 on August 4 before abruptly decelerating to 0.271 on August 5 amidst that massive volume spike. This glaring divergence—where extreme off-exchange volume and vanishing short interest meet a violently collapsing rolling CLV—screams of institutional stealth distribution. The smart money has stopped buying the highs; they are utilizing off-exchange liquidity facilities to quietly pass the heavy bags to retail momentum chasers while carefully masking their exit.
Hedging for the Apocalypse
Diving into the options time-series data, the derivative undercurrents validate this ominous setup. Looking at the net DEX, institutional exposure remains overwhelmingly bullish on the surface, with the net Delta exposure surging past 636 million in early August, heavily skewed by a massive 705 million call DEX. However, the trend in net GEX and the alarming explosion in the OTM put/call OI ratio tell the real story. Over the past month, net GEX has steadily expanded to a positive 9.37 million, trapping the stock in a long-gamma environment where market makers actively suppress volatility and force mean reversion, effectively cushioning the stock’s ascent and preventing sudden intraday collapses. The critical warning sign, however, lies in the OTM put/call OI ratio, which skyrocketed from a benign 1.5 in mid-July to an absolutely staggering 6.70 by August 5. This monumental shift proves that while large players are maintaining their directional long exposure, they are simultaneously accumulating unprecedented levels of tail-risk hedging. They are structurally long but deeply terrified, buying out-of-the-money puts at a frantic pace to insure against a sudden gap-down once the positive gamma regime breaks and flips negative—a structural transition that would ruthlessly amplify downside volatility and trigger a violent price inflection.
Structuring the End Game
A forensic look at the current options snapshot reveals exactly where the market is pricing this inevitable collision. The stock is currently trading at $272.63, precariously wedged right above the macro September 18 call wall at $270 and directly below the immediate August 21 front-month call wall at $280. The fact that the price has breached the macro call wall means any pullback below $270 could trigger an aggressive gamma un-pinning. Examining the GEX distribution by expiration, we see that gamma is overwhelmingly dominated by the near-term—with August and September expirations collectively commanding nearly 5 million in net GEX—while the distant 2027 expiries look like absolute ghost towns. This near-term gamma dominance means the current price structure is fragile and hyper-sensitive to imminent expirations rather than long-term fundamentals. Furthermore, the term structure and moneyness heavily skew toward downside panic: the deep OTM put OI sits at a colossal 22,255 contracts compared to a paltry 766 deep OTM calls, and the short-term implied volatility (6-21 days) is blazing at 49.7%, trading at a massive premium to the longer-term (63D+) IV of 38.3%. The market is explicitly pricing in near-term turbulence, utilizing the $260 macro put wall as the ultimate floor, expecting a sharp mean reversion the moment the $270-$280 gamma trap breaks.
The Insider Exodus
If the derivatives data isn't enough to convince you, look at who is running for the fire exits. While institutions build their volatility bunkers, Nucor’s C-suite is aggressively liquidating. Throughout the summer, we’ve seen relentless Form 144 filings and direct stock sales from key executives. CEO Leon Topalian dumped massive blocks in May ($11.9 million). Executive VP Kenneth Query offloaded $3.4 million in June. Executive VP Daniel Needham just sold over $5.3 million in late July. When the architects of the company are dumping shares into a 96% rally while the options market buys 6 times as many out-of-the-money puts as calls, you don't ask questions. You pay attention.
Final Thoughts
Nucor is a masterclass in late-stage market mechanics right now. The surface fundamentals look pristine, perfectly engineered to draw in late retail liquidity. But beneath the surface, off-exchange distribution is peaking, gamma is artificially pinning the price, and institutional tail-risk hedging is at historical extremes. The steel trap is set. Don't be the one left providing exit liquidity when it finally snaps shut.