In This Article:
DKNG
Sponsored
The Hidden Spring in DraftKings: Decoding the Institutional Stealth Bid
BullishStrongChange from report: -6.3%1M: -7.7%
Published on 2026-07-09 by TradeFomo
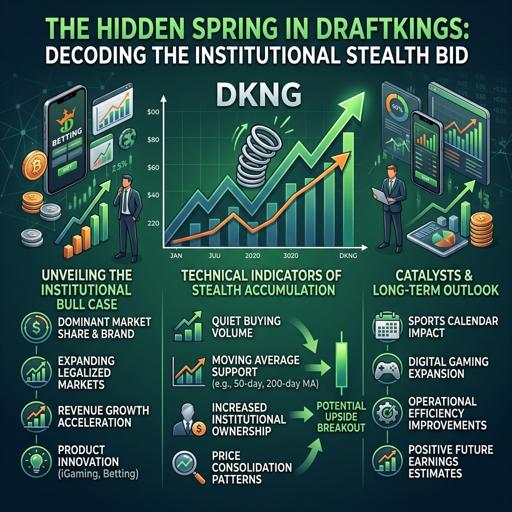
If you watch the mainstream financial media, DraftKings (DKNG) looks like a confusing, erratic chart. Retail traders see a stock that violently sold off from $30.00 in mid-June down to the $23.00 level by late June, only to painfully grind its way back above $27.00 today. The retail consensus is mired in confusion, distracted by tax-related insider stock dispositions and choppy daily price action.
However, if you ignore the noise and look directly into the structural plumbing of the market—specifically off-exchange liquidity and options dealer positioning—a completely different narrative emerges. We are not witnessing a disorganized, volatile chop. We are watching a highly orchestrated, stealth institutional accumulation. The spring is being tightly coiled, and the bears are currently standing on the wrong side of the tracks.
The Dark Pool Breadcrumbs: Trapping the Bears
Let's look at the critical interaction between the TRF ratio, the short selling volume percentage in off-exchange venues, the volume Z-score, and the rolling closing position value. When the TRF ratio and the volume Z-score print recent extremes on the exact same day, it is generally the clearest signal that a new trend is about to begin. We witnessed this exact setup forming as DraftKings capitulated and subsequently bottomed in late June. By combining these four metrics, we can decode abnormal fund flows and unmask hidden institutional behaviors. Recently, the short selling percentage in the dark pools has consistently pegged at elevated extremes (hitting the 90th percentile), yet the trend of the rolling closing position value has steadily surged higher. This shift in the closing position power confirms that deep-pocketed bulls are silently absorbing the off-exchange selling pressure. Furthermore, with the volume Z-score recently dropping into deep negative territory, we are looking at a classic price-volume divergence: overall public volume is drying up, but relentless institutional stealth accumulation off-exchange is successfully trapping the bears and forcing the underlying price upward.
The Greek Engine: Delta Squeezes and Gamma Floors
Turning our attention to the time-series options data, the trend in net GEX (net Gamma exposure) perfectly illustrates how market maker positioning is dictating the current price action. In late June, net GEX compressed and flirted with the zero line; this critical positive-to-negative transition zone acted as the exact price inflection point that sparked the ongoing rally. Since then, net GEX has robustly expanded to +16.9M. This indicates that dealers are now holding heavy positive Gamma, a condition that structurally buffers downside volatility and fuels a mean-reverting grind higher on any intraday dips. Concurrently, the net DEX (net Delta exposure) direction provides a massive directional tell: it has exploded from a meager +22M in late June to an overwhelming +381M today. This definitively confirms that the overall institutional exposure is aggressively net long. Meanwhile, the OTM put/call OI ratio has crept up from 0.22 to 0.45 over the last two weeks. While the absolute level remains undeniably bullish, this upward trajectory shows that as the stock climbs, a layer of tail risk hedging is actively accumulating in the background. Smart money is quietly buying cheap downside protection to lock in their newly acquired equity gains, setting up a floor without sacrificing the upside.
Structural Pricing: Walls, Skews, and Expirations
A deep dive into the current options holding structure offers a precise map of the market's pricing expectations for recent price action. Key support and resistance levels are heavily fortified: the near-term Call Wall currently stands at $27.50, acting as the immediate ceiling that DKNG is testing right at this moment, while the Put Wall serves as a concrete structural support floor at $25.00 for both the front-month and macro (August 21) horizons. Analyzing the GEX distribution by expiration date reveals that this market is overwhelmingly dominated by near-term gamma (specifically the July 10 and July 17 expirations) rather than far-dated flows, meaning short-dated options dealers are in full control of the current tape.
When we look at the term structure, the open interest distribution is heavily skewed toward calls, yet the implied volatility skew tells a completely different, almost contradictory behavioral story. In the ultra-short 0-5 day window, the implied volatility for puts is priced at an astronomical 1.896 versus just 0.390 for calls. This massive divergence signifies that while institutions are fundamentally positioned for a breakout toward the macro $30.00 Call Wall, retail and speculative market participants are paradoxically overpaying for immediate downside tail-risk. The market is pricing in an exaggerated fear of a rug-pull, drastically underestimating the probability of a continued upside drift.
Smart Money Filings and The Final Verdict
When you cross-reference this quantitative data with recent SEC filings, the fundamental picture aligns perfectly with the structural data. We recently saw Vanguard establish a massive 5.02% stake and FMR (Fidelity) build out a 1.9% position. Retail bears have pointed to Director Matthew Kalish's $31.7M stock transaction in May as an "insider dump," completely misunderstanding the mechanics. Kalish utilized a prepaid variable forward sale contract—a highly sophisticated structured finance maneuver that allows him to monetize his holdings while retaining voting rights and maintaining exposure to the stock's upside up to $40.00 a share. This is the hallmark of tax-efficient liquidity management, not a bearish capitulation.
DraftKings is currently printing a technical golden cross, supported by a hidden bid in the dark pools and a massive positive delta buildup in the options market. The bears are aggressively shorting into an institutional vacuum, completely unaware that dealers are positively convex and ready to squeeze them through the $27.50 Call Wall. As the volume Z-score stays compressed, it will only take a minor spark of localized volume to break this coiled spring wide open, forcing a rapid repricing toward the $30.00 macro target before August earnings.
Sponsored